This page presents selected examples of treatment outcomes based on combined psychotherapy and neurofeedback interventions. The information shown reflects changes observed before and after treatment and is intended to illustrate how therapy and neurofeedback may support emotional, psychological, and cognitive improvement. The examples demonstrate typical patterns of progress rather than guaranteed results.

This report pertains to a 10-year-old girl with no medical or medication history. Her parents expressed concerns regarding her mood instability, difficulty sustaining attention, and limited engagement in classroom activities.

Protocol: SW-LORETA 19-channel Neurofeedback

Assessment Dates:

  • Baseline qEEG: [01/30/2025]
  • Post-Training qEEG: [10/26/2025]
    Total Sessions: 29

-Z Score Summary Information Montage: LE

This section shows how much the client’s brainwaves deviate from what is expected for someone her age.

  • Green = normal/healthy
  • Yellow/Red = too high (overactive)
  • Blue = too low (underactive)

Before:

  • Before training, there were yellow and red patches, especially linked to anxiety and attention difficulty.
  • After training, most areas became green, showing that the brainwaves moved much closer to healthy norms.

After:

- T/B ratio (Row- Z-score)

The Theta/Beta Ratio is one of the most important qEEG markers used to understand a person’s ability to focus, stay alert, and regulate attention.

 What it measures:

  • Theta waves = slow brainwaves linked to daydreaming, distractibility, and mental wandering
  • Beta waves = faster brainwaves linked to focus, mental effort, and active thinking

The T/B ratio compares the number of slow waves to fast waves.

Before:

  • This pattern is consistent with ADHD-like symptoms, making it harder for the child to maintain attention in school or during tasks requiring concentration.
  • The brain no longer shows the high imbalance seen before training.

After:

-Attention and Focus (Objective Metrics)

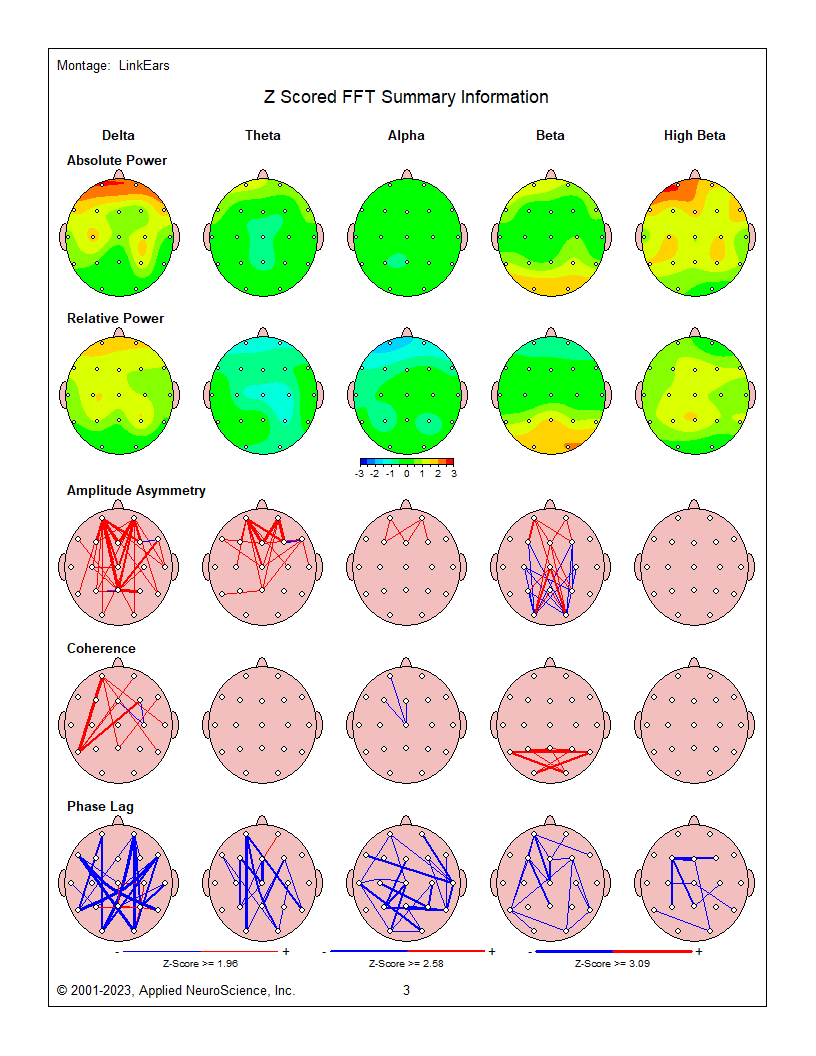
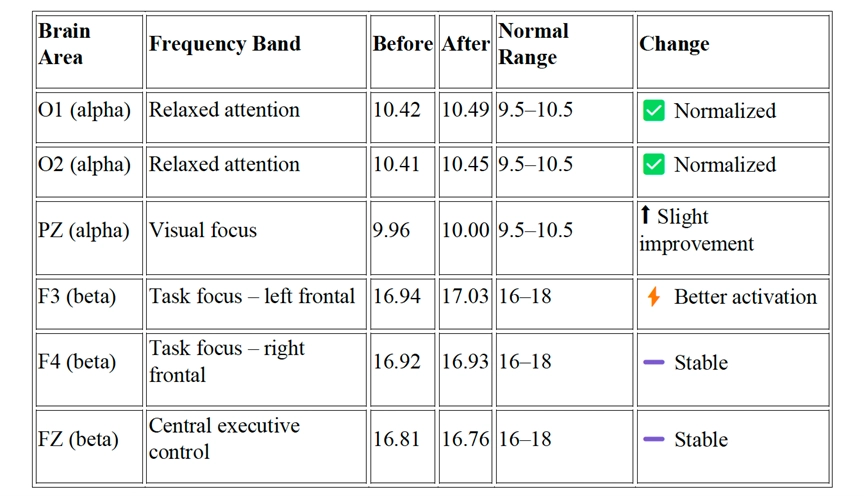
Overall, the individual shows normalized alpha activity in visual attention areas (O1, O2, PZ) and adequate beta activation in frontal regions (F3, F4, FZ). This pattern indicates improved relaxed attention, balanced focus, and stable executive control after training. Now let’s have a look one by one:

-FFT Absolute Power Maps

The FFT Absolute Power Maps show how strong each type of brainwave is in different parts of the brain. Each color represents whether the brain is producing too much, too little, or a healthy amount of each frequency band (delta, theta, alpha, beta).

Before:

  • The brain was overactive and imbalanced, making it harder to focus, stay calm, or manage emotions.

After:

  • The Brain activity is normalized, calmer, and better regulated, supporting improved attention, emotional stability, and daily functioning.